Executive Summary:
- Home sales activity continued with annual declines posting a 10 percent year-over-year (YOY) decline in the first quarter.
- However, San Mateo and Santa Clara see an increase in sales of homes priced below $1 million for the first time in 26 months, helped by the increases in inventories from previous months.
- Sales priced over $2 million have slowed notably compared to 2018, down 25 percent YOY in Q1, but still above 2017 levels.
- For-sale inventories are up 14 percent overall with all regions having more inventory than last year.
- However, after a short period of improved inventories, sellers in San Francisco took homes off the market in recent months waiting for IPO buyers – bringing inventories below last year’s levels in all price ranges.
- Median home prices were down 3 percent YOY in March, mostly due to an increase of lower-priced sales compared to last year.
- Santa Clara and Sonoma post relatively larger YOY declines in home prices, 12 percent and 8 percent respectively. However, 2018 spring prices in the two regions grew at unsustainable rates.
- Bay Area housing markets have all the characteristics of a potentially robust home-buying season — more inventories, lower mortgage interest rates than last spring, motivated buyers and sellers, and possibly more IPOs in the pipeline.
Following a doldrum first quarter for housing market activity in the Bay Area, potential impacts around Lyft and Uber’s already filed IPOs and anticipated IPOs have started driving buyer and seller behaviors.
A look back at the first quarter activity suggests buyer hesitation, which started in second half of 2018 and continued into early months of 2019 bringing home sales down 10 percent below last year’s levels. The largest monthly decline, however, occurred in March when sales dropped 14 percent, compared to 7 percent and 6 percent respectively in January and February. In most all Bay Area regions, except Alameda, first quarter 2019 was the slowest in last five years. The slump in sales activity resulted from many factors, almost too many to count, with weather bringing the last punch.
Nevertheless, homes priced $2 million and higher experienced relatively larger year-over-year declines in sales activity, while homes priced below $1 million finally reversed the double-digit declines that characterized 2018, declining at the slowest rate compared to higher-priced sales. Improvement in sales of homes priced below $1 million was helped by year-over-year increases in sales in San Mateo and Santa Clara – the first annual increase after at least 26 months of declines which sometimes reached as much as 40 to 60 percent. Table 1 summarizes changes in the number of sales by region compared to last year’s first quarter.
Table 1
Source: Source: Terradatum, Inc. from data provided by local MLSes, April 7, 2019
While higher-priced sales did experience a relatively larger drop off in activity compared to 2018, higher-priced sales still trend above 2017 levels and the years prior. Last year saw a surge in sales of homes priced above $2 million. Figure 1 illustrates monthly sales activity by price range, the black line highlighting sales priced at $2 million and above. Note that sales activity nearly doubled between the summer of 2017 and 2018, peaking in May 2018. As Table 1 suggests, most all regions except Alameda saw fewer sales above $2 million than last year. Count-wise, declines were mostly driven by Santa Clara and San Mateo.
San Mateo and Santa Clara did see a jump in sales of homes priced below $1 million, both up 8 percent, which may suggest buyers are responding to anticipated IPO impacts. However, these were also the areas with a robust buildup in for-sale inventory of homes priced below $1 million starting in fall of last year. Thus, availability of the inventory may have pulled in buyers who have been desperately waiting for more affordably priced homes.
Figure 1: Number of monthly home sales in the Bay Area, by price range
Source: Source: Terradatum, Inc. from data provided by local MLSes, April 7, 2019
Sellers also seem to be also responding to Lyft and Uber and potentially other IPO filings. For example, while Santa Clara averaged 30 percent more inventory in the first quarter, San Mateo sellers tested out the market between November and January, driving inventory up an average of 21 percent above last year, then driving inventory down 10 percent again in March.
San Francisco sellers responded the same way. After the first annual increases in 25 months between October and December, inventory declined again by 32 percent year-over-year in February and March – the largest declines across the region seen among homes priced below $1 million. However, San Francisco sellers of all price ranges decided to hold off on listing their homes, whereas there were more sellers of higher-priced homes across all other Bay Area regions.
To illustrate San Francisco sellers’ response, Figure 2 tracks monthly year-over-year changes in for-sale home inventory in San Francisco overall, San Francisco inventory below $1 million, and overall Bay Area without San Francisco. The black line is highlighting the relative drop in San Francisco inventories below $1 million in the last two months, after a short three-month increase during the winter months.
Figure 2: Year-over-year change in for-sale inventory
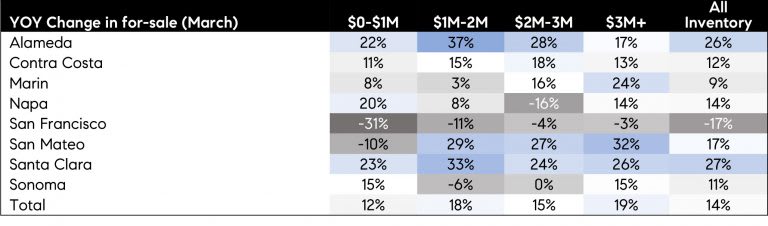
Table 2 summarizes March’s year-over-year change in inventories across all Bay Area communities. Fortunately for Bay Area home buyers, inventory options have generally improved compared to last year. In addition, inventory of homes priced below $1 million has improved, driven by jumps in Alameda and Santa Clara.
Table 2
While anticipations are running high on how Lyft and Uber IPOs may affect Bay Area housing markets, particularly San Francisco, median home prices remain below last spring’s high. Note that beginning in fall 2017, median home price growth started accelerating at double digit rates, reaching as much as 18 percent year-over-year growth in March. Median prices peaked in May 2018. Price growth has moderated since then, and more recently fell below last year’s levels. However, as noted above, the share of higher-priced sales also declined since last summer peaks, thus more lower-priced sales are affecting the mix of sales and lower year-over-year rates. Figure 3 illustrates median price trend in San Francisco and the Bay Area overall. While a seasonal increase in home prices from January lows is evident across the Bay Area region, San Francisco and Marin (not in chart) experienced a relatively higher jump than in other areas, with San Francisco jumping 16 percent, Marin 21 percent, and the overall Bay Area 12 percent. Still, none of these suggest any trends as seasonal jumps of that magnitude have been historically consistent.
Table 3 summarizes March median home prices, year-over-year change, and first quarter change. Most notable declines remain in Santa Clara and Sonoma, both of which saw a rather significant run up in prices in early 2018. In both regions, prices are back to where they were before the 2018 run up.
Table 3
Figure 3: Median Home Prices
Source: Source: Terradatum, Inc. from data provided by local MLSes, April 7, 2019
In summary, it will be an interesting year ahead for Bay Area housing markets. While much of Lyft and Uber IPO monies will be constrained by employees’ lock-up periods in the coming months, housing markets certainly have all the characteristics of a potentially robust home-buying season — more inventories, lower mortgage interest rates than last spring, motivated buyers and sellers, and more IPOs in the pipeline. Stay tuned!